Andrea Villanes GIS Portafolio

Wednesday, December 3, 2008

Geostatistics using ArcGIS


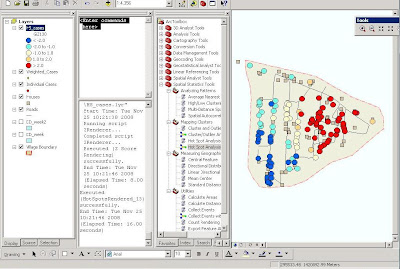
Spatial Statistics Tools toolbox in ArcGIS was used to examine the spatial pattern and distribution of a dengue fever outbreak in India. The map results from the hot spot analysis reveal a statistically significant clustering of dengue fever cases in the east, given the overall pattern of dengue in the village.

Click the image to enlarge.

Created by Andrea Villanes

Spatial Modelling using ArcGIS Model Builder


The map displays the value of each cell across the landscape in a 41-county area served by Progress Energy in eastern North Carolina, with values ranging from 1 to 9 with 9 representing the greatest value as conservable farmland. The areas in grays are less suitable for farmland conservation or are excluded from the results because they are already conserved or already developed for other purposes. The map was developed using ArcGIS and ModelBuilder as a tool for processing and analyzing the data.

Click the image to enlarge.

Created by Andrea Villanes

Geoprocessing using ArcGIS


The map shows the hay production on the Petersburg, VA National Park. The analysis to determine how many horses can be supported by potential hay production on the Petersburg, VA National Park was made using ArcGIS. Two shaped files were intersected and the ArcToolBox was used to calculate the number of horses can be supported by the potential hay production.

Click the image to enlarge.

Created by Andrea Villanes

World Wide Cotton Predicted Production for 2009


The map was created using ArcGIS. The map shows 5 classes of predicted World Wide cotton production level for 2009. The prediction for one year was made using SAS and the data was joined in ArcMap to the geography file of countries boundaries using SASBridge and Arc Catalog.

Click the image to enlarge.

Created by: Andrea Villanes

World Wide Cotton Production for 2007-2008


The map was created using ArcGIS. The map shows 5 classes of production level of the World Wide cotton production for 2007-2008. The data used was joined in ArcMap to the geography file of countries boundaries using the country code (ISO).

Click the image to enlarge.

Created by: Andrea Villanes

Mapping Wake County Census Tracts


We can see the map of the number of PhDs for the population greater than the age of 25 in the Census Tracts for Wake County. The census tract data was exported to an excel file and was joined with census tract geography data. The map shows graduated color display based on number of PhDs for population older than 25 in Wake County Census Tracts.

Click the image to enlarge.

Created by: Andrea Villanes

Railhawk Soccer Fan Survey Data


The map was created using ArcGIS. The data was an excel file with the survey data from the Railhawk Soccer Fans that attended the soccer games. The data was joined with the US Map in ArcMap using the 5 digit Zip Code. The map shows graduated color display based in the number of persons.

Click the image to enlarge.

Created by: Andrea Villanes